import os
import warnings

import contextily as cx
import geopandas as gpd
import matplotlib.pyplot as plt
import networkx as nx
import osmnx as ox
import pandas as pd
from geopy.distance import geodesic
from matplotlib.axes import Axes
from scipy.spatial import cKDTree

warnings.filterwarnings("ignore")Road and Ferry Transport Network of Bicol Region
This notebook builds a multi-modal transport network for the Bicol Region. It downloads road and ferry data from OpenStreetMap, merges them into a single graph, and performs an initial accessibility analysis from Legazpi City.
0 Preliminaries
BASE_PATH = os.path.join(".", "outputs")
GDF_BOUNDS = gpd.read_file(os.path.join(BASE_PATH, "boundaries.gpkg"))

ORIGIN_TOWN = "Legazpi City"
def plot_with_basemap(
ax: Axes,
title: str,
filename: str = None,
padding: float = 0.1,
) -> None:
x_min, y_min, x_max, y_max = GDF_BOUNDS.total_bounds
ax.set_xlim(x_min - padding, x_max + padding)
ax.set_ylim(y_min - padding, y_max + padding)
cx.add_basemap(
ax,
crs=GDF_BOUNDS.crs,
source=cx.providers.CartoDB.Positron,
attribution="",
)
ax.set_title(title)
ax.set_axis_off()
plt.tight_layout()
if filename:
filepath = os.path.join(BASE_PATH, filename)
plt.savefig(filepath, dpi=300, bbox_inches="tight")
plt.show()
def get_labeled_undirected_graph(
G: nx.MultiDiGraph,
mode: str,
) -> nx.MultiGraph:
G = G.to_undirected()
for _, data in G.nodes(data=True):
data["mode"] = mode
for _, _, data in G.edges(data=True):
data["mode"] = mode
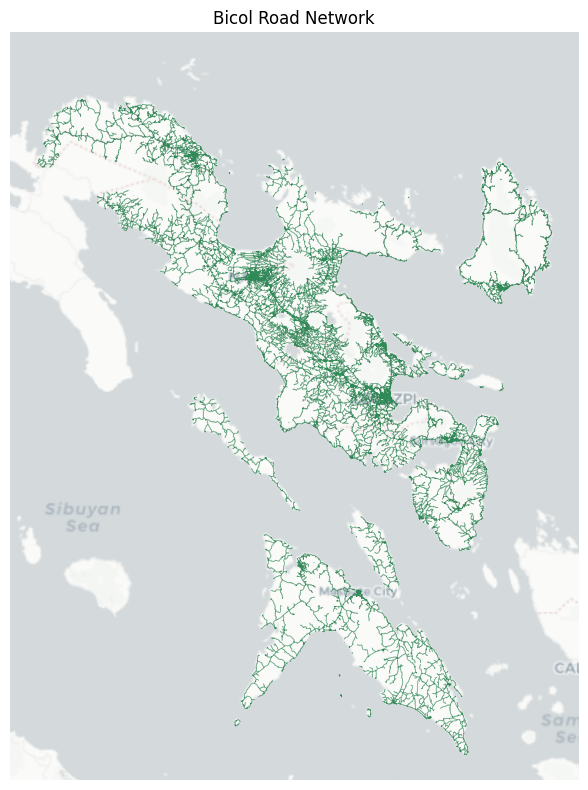
return G1 Generate road network
graph_roads = ox.graph_from_place(
    "Bicol Region",
    network_type="drive_service",
    simplify=False,
    retain_all=True,
)

graph_roads = get_labeled_undirected_graph(graph_roads, "road")

len(graph_roads.nodes), len(graph_roads.edges)
(446869, 460990)_, ax = plt.subplots(figsize=(8, 8))
ox.plot_graph(
graph_roads,
ax=ax,
node_size=0,
edge_color="seagreen",
edge_linewidth=0.5,
show=False,
close=False,
)
plot_with_basemap(
ax,
title="Bicol Road Network",
filename="road_network.png",
)
filepath = os.path.join(BASE_PATH, "road_network.graphml")
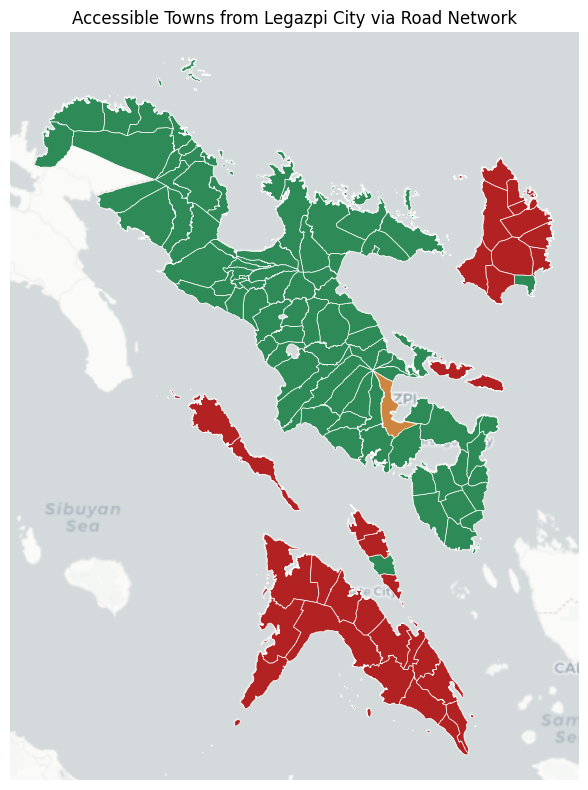
ox.save_graphml(graph_roads, filepath=filepath)3 Initial road-only accessibility analysis
def get_accessible_towns(
    graph: nx.Graph,
) -> pd.Series:
    orig_geom = GDF_BOUNDS[GDF_BOUNDS["town"] == ORIGIN_TOWN].union_all()
    orig_point = orig_geom.centroid
    orig_node = ox.nearest_nodes(graph, orig_point.x, orig_point.y)

    reach_nodes = {orig_node} | nx.descendants(graph, orig_node)
    reach_graph = graph.subgraph(reach_nodes)
    gdf_reach_edges = ox.graph_to_gdfs(reach_graph, nodes=False, edges=True)

    if gdf_reach_edges.empty:
        reach_towns = set()
    else:
        gdf_reachable_towns = gpd.sjoin(
            GDF_BOUNDS,
            gdf_reach_edges,
            how="inner",
            predicate="intersects",
        )
        reach_towns = set(gdf_reachable_towns["town"].unique())

    return reach_towns


def plot_accessibility_map(
    accessible_towns: set[str],
    title: str,
    filename: str = None,
) -> None:
    _, ax = plt.subplots(figsize=(8, 8))

    origin = GDF_BOUNDS[GDF_BOUNDS["town"] == ORIGIN_TOWN]

    mask = GDF_BOUNDS["town"].isin(accessible_towns)
    reachable = GDF_BOUNDS[mask]
    unreachable = GDF_BOUNDS[~mask]

    reachable.plot(
        ax=ax,
        color="seagreen",
        edgecolor="white",
        linewidth=0.5,
        label="Accessible",
    )

    origin.plot(
        ax=ax,
        color="peru",
        edgecolor="white",
        linewidth=0.5,
        label="Origin",
    )

    if not unreachable.empty:
        unreachable.plot(
            ax=ax,
            color="firebrick",
            edgecolor="white",
            linewidth=0.5,
            label="Inaccessible",
        )

    plot_with_basemap(ax=ax, title=title, filename=filename)
accessible_towns = get_accessible_towns(graph=graph_roads)
plot_accessibility_map(
accessible_towns=accessible_towns,
title=f"Accessible Towns from {ORIGIN_TOWN} via Road Network",
filename="initial_accessibility_map.png",
)
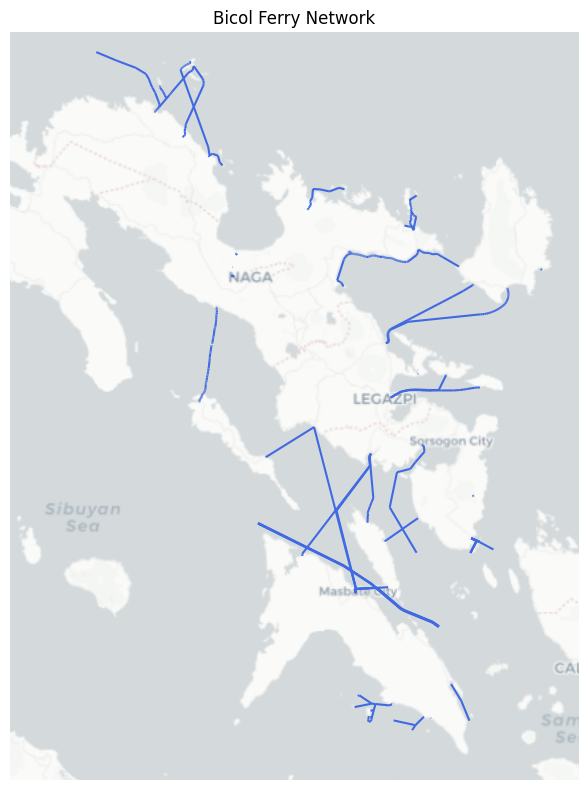
4 Load ferry transport network
graph_ferry = ox.graph_from_place(
    "Bicol Region",
    custom_filter='["route"="ferry"]',
    retain_all=True,
    simplify=False,
)

graph_ferry = get_labeled_undirected_graph(graph_ferry, "ferry")

len(graph_ferry.nodes), len(graph_ferry.edges)
(1087, 1060)_, ax = plt.subplots(figsize=(8, 8))
ox.plot_graph(
graph_ferry,
ax=ax,
node_size=0,
edge_color="royalblue",
edge_linewidth=1.5,
show=False,
close=False,
)
plot_with_basemap(
ax,
title="Bicol Ferry Network",
filename="ferry_network.png",
)
filepath = os.path.join(BASE_PATH, "ferry_network.graphml")
ox.save_graphml(graph_ferry, filepath=filepath)
5 Merge road and ferry networks
def merge_networks(
    graph_roads: nx.MultiDiGraph,
    graph_ferry: nx.MultiDiGraph,
    max_dist_m: int = 500,
) -> nx.MultiDiGraph:
    graph_merged = nx.compose(graph_roads, graph_ferry)

    nodes = ox.graph_to_gdfs(graph_merged, edges=False)[["x", "y", "mode"]]
    ferry_nodes = nodes[nodes["mode"] == "ferry"]
    road_nodes = nodes[nodes["mode"] == "road"]
    tree = cKDTree(road_nodes[["y", "x"]].values)

    for s_id, s_data in ferry_nodes.iterrows():
        s_coord = (s_data["y"], s_data["x"])
        _, idx = tree.query(s_coord, k=1)

        l_id = road_nodes.index[idx]
        l_coord = (road_nodes.iloc[idx]["y"], road_nodes.iloc[idx]["x"])
        dist_m = geodesic(s_coord, l_coord).meters

        if dist_m <= max_dist_m:
            for u, v in [(s_id, l_id), (l_id, s_id)]:
                graph_merged.add_edge(u, v, length=dist_m, mode="road")

    return graph_merged


def prune_terminal_ferry_nodes(G: nx.MultiDiGraph) -> nx.MultiDiGraph:
    graph_pruned = G.copy()

    while True:
        terminal_nodes_to_remove = [
            node
            for node, degree in graph_pruned.degree()
            if degree == 1 and graph_pruned.nodes[node].get("mode") == "ferry"
        ]
        if not terminal_nodes_to_remove:
            break
        graph_pruned.remove_nodes_from(terminal_nodes_to_remove)

    return graph_pruned
graph_merged = merge_networks(graph_roads, graph_ferry)
graph_merged = prune_terminal_ferry_nodes(graph_merged)
filepath = os.path.join(BASE_PATH, "merged_network_full.graphml")
ox.save_graphml(graph_merged, filepath)
graph_merged.number_of_nodes(), graph_merged.number_of_edges()(447510, 462305)graph_merged = nx.MultiDiGraph(graph_merged)
graph_merged = ox.simplify_graph(graph_merged)
graph_merged = graph_merged.to_undirected()
filepath = os.path.join(BASE_PATH, "merged_network_simplified.graphml")
ox.save_graphml(graph_merged, filepath)
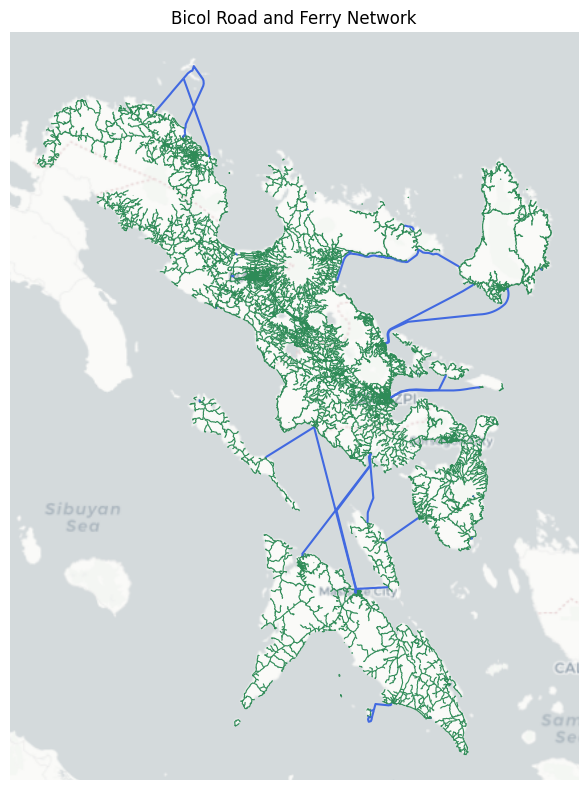
graph_merged.number_of_nodes(), graph_merged.number_of_edges()(56932, 71895)fig, ax = plt.subplots(figsize=(8, 8))
_, edges = ox.graph_to_gdfs(graph_merged)
edges = edges.reset_index()
edges[edges["mode"] == "road"].plot(
ax=ax,
color="seagreen",
linewidth=0.8,
label="Road Network",
)
edges[edges["mode"] == "ferry"].plot(
ax=ax,
color="royalblue",
linewidth=1.5,
label="Ferry Routes",
)
plot_with_basemap(
ax=ax,
title="Bicol Road and Ferry Network",
filename="merged_network.png",
)
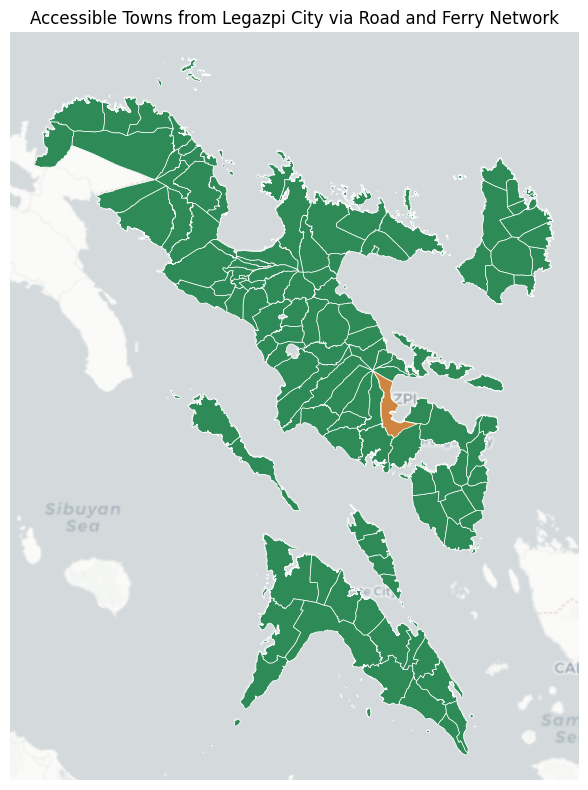
6 Final accessibility analysis
accessible_towns = get_accessible_towns(graph=graph_merged)

plot_accessibility_map(
    accessible_towns=accessible_towns,
    title=f"Accessible Towns from {ORIGIN_TOWN} via Road and Ferry Network",
    filename="final_accessibility_map.png",
)