import os
import warnings

import contextily as cx
import geopandas as gpd
import matplotlib.pyplot as plt
import networkx as nx
import osmnx as ox
import pandas as pd

warnings.filterwarnings("ignore")Critical Road Infrastructure
This notebook identifies and analyzes the most critical parts of the transport network. It pinpoints nodes with the highest betweenness centrality and then maps their distribution across provinces and towns.
0 Setup environment
BASE_PATH = "data"
BOUNDARIES_FILE = os.path.join(BASE_PATH, "boundaries.gpkg")
TRANSPORT_NETWORK_FILE = os.path.join(BASE_PATH, "merged_network_weighted.graphml")
CENTRALITY_FILE = os.path.join(BASE_PATH, "centrality_measures.csv")
1 Load baseline data
df_centrality = pd.read_csv(CENTRALITY_FILE).set_index("osmid")
df_centrality.head()| degree | closeness | betweenness | |
|---|---|---|---|
| osmid | |||
| 300744370 | 0.000053 | 0.003119 | 0.003929 |
| 300744933 | 0.000053 | 0.003071 | 0.002748 |
| 300744970 | 0.000053 | 0.003209 | 0.000208 |
| 300745522 | 0.000053 | 0.003549 | 0.003817 |
| 300746507 | 0.000053 | 0.003476 | 0.003332 |
graph_transport = ox.load_graphml(TRANSPORT_NETWORK_FILE)
gdf_nodes = ox.graph_to_gdfs(graph_transport, edges=False)
gdf_nodes = gdf_nodes[["geometry"]]
gdf_nodes.head()| geometry | |
|---|---|
| osmid | |
| 300744370 | POINT (124.03376 11.76261) |
| 300744933 | POINT (124.06395 11.76468) |
| 300744970 | POINT (124.05778 11.86383) |
| 300745522 | POINT (123.90828 11.91029) |
| 300746507 | POINT (123.99164 11.96455) |
gdf_nodes = gdf_nodes.join(df_centrality)
print(f"Loaded {len(gdf_nodes)} nodes with centrality measures.")
gdf_nodes.head()
Loaded 56932 nodes with centrality measures.| geometry | degree | closeness | betweenness | |
|---|---|---|---|---|
| osmid | ||||
| 300744370 | POINT (124.03376 11.76261) | 0.000053 | 0.003119 | 0.003929 |
| 300744933 | POINT (124.06395 11.76468) | 0.000053 | 0.003071 | 0.002748 |
| 300744970 | POINT (124.05778 11.86383) | 0.000053 | 0.003209 | 0.000208 |
| 300745522 | POINT (123.90828 11.91029) | 0.000053 | 0.003549 | 0.003817 |
| 300746507 | POINT (123.99164 11.96455) | 0.000053 | 0.003476 | 0.003332 |
CRITICALITY_PERCENTILE = 0.95  # Define "critical" as the top 5% of nodes based on betweenness centrality

betweenness_threshold = gdf_nodes["betweenness"].quantile(CRITICALITY_PERCENTILE)
gdf_critical_nodes = gdf_nodes[gdf_nodes["betweenness"] >= betweenness_threshold]

f"Identified {len(gdf_critical_nodes)} critical nodes (top {100-CRITICALITY_PERCENTILE*100:.0f}%) with betweenness >= {betweenness_threshold:.6f}"
'Identified 2847 critical nodes (top 5%) with betweenness >= 0.014295'gdf_boundaries = gpd.read_file(BOUNDARIES_FILE)
_, gdf_edges = ox.graph_to_gdfs(graph_transport)2 Identify critical nodes
fig, ax = plt.subplots(1, 1, figsize=(8, 8))

gdf_boundaries.plot(
    ax=ax,
    edgecolor="gray",
    facecolor="none",
    linewidth=1.0,
    alpha=0.7,
    zorder=2,
    label="Town Boundaries",
)
gdf_edges.plot(
    ax=ax,
    linewidth=0.5,
    edgecolor="#d3d3d3",
    alpha=0.8,
    zorder=1,
    label="Transport Network",
)

gdf_critical_nodes.plot(
    ax=ax,
    marker="o",
    color="firebrick",
    markersize=10,
    zorder=3,
    label=f"Critical Nodes\nTop {100-CRITICALITY_PERCENTILE*100:.0f}% Betweenness",
)

cx.add_basemap(ax, crs=gdf_boundaries.crs, source=cx.providers.CartoDB.Positron, attribution="")

ax.set_title("Critical Infrastructure Nodes in Bicol Region")
ax.set_axis_off()
ax.legend(loc="upper right", prop={"size": 10})
plt.tight_layout()

filepath = os.path.join(BASE_PATH, "critical_infrastructure_map.png")
plt.savefig(filepath, dpi=300, bbox_inches="tight")

plt.show()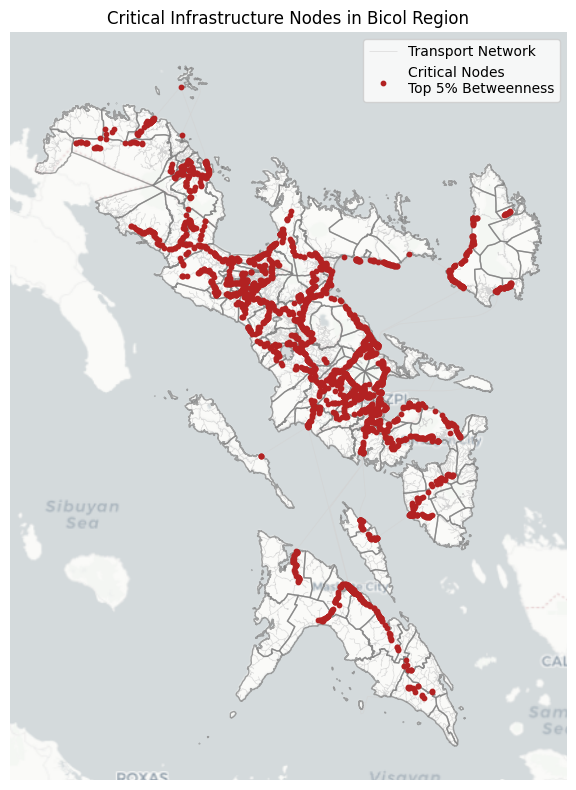
3 Analyze distribution of critical nodes
gdf_critical_nodes_located = gpd.sjoin(gdf_critical_nodes, gdf_boundaries, how="inner", predicate="within")
gdf_critical_nodes_located.head()| geometry | degree | closeness | betweenness | index_right | town | province | |
|---|---|---|---|---|---|---|---|
| osmid | |||||||
| 300750509 | POINT (123.96609 11.94667) | 0.000053 | 0.003525 | 0.017540 | 82 | Cataingan | Masbate |
| 352385867 | POINT (123.893 11.94182) | 0.000070 | 0.003612 | 0.022548 | 94 | Placer | Masbate |
| 1783355398 | POINT (123.93129 11.91621) | 0.000053 | 0.003549 | 0.017973 | 94 | Placer | Masbate |
| 1783355566 | POINT (123.92514 11.92446) | 0.000053 | 0.003562 | 0.017986 | 94 | Placer | Masbate |
| 1783355816 | POINT (123.92134 11.93063) | 0.000053 | 0.003574 | 0.018054 | 94 | Placer | Masbate |
df_province_counts = gdf_critical_nodes_located["province"].value_counts().reset_index()
df_province_counts.columns = ["province", "critical_node_count"]

filepath = os.path.join(BASE_PATH, "critical_nodes_by_province.csv")
df_province_counts.to_csv(filepath, index=False)

print("--- Critical Nodes per Province ---")
print(df_province_counts)
--- Critical Nodes per Province ---
province critical_node_count
0 Camarines Sur 993
1 Albay 819
2 Masbate 305
3 Sorsogon 268
4 Camarines Norte 207
5 Catanduanes 169fig, ax = plt.subplots(1, 1, figsize=(8, 8))
gdf_provinces = gdf_boundaries.dissolve(by="province", aggfunc="sum")
gdf_provinces = gdf_provinces.merge(df_province_counts, on="province")
gdf_provinces.plot(
column="critical_node_count",
ax=ax,
legend=True,
legend_kwds={
"label": "Number of Critical Nodes",
"orientation": "horizontal",
"pad": 0.01,
"shrink": 0.5,
},
cmap="OrRd",
edgecolor="white",
linewidth=0.5,
)
cx.add_basemap(
ax,
crs=gdf_provinces.crs,
source=cx.providers.CartoDB.Positron,
attribution="",
)
ax.set_title("Distribution of Critical Transport Nodes by Province")
ax.set_axis_off()
plt.tight_layout()
filepath = os.path.join(BASE_PATH, "critical_nodes_choropleth_province.png")
plt.savefig(filepath, dpi=300, bbox_inches="tight")
plt.show()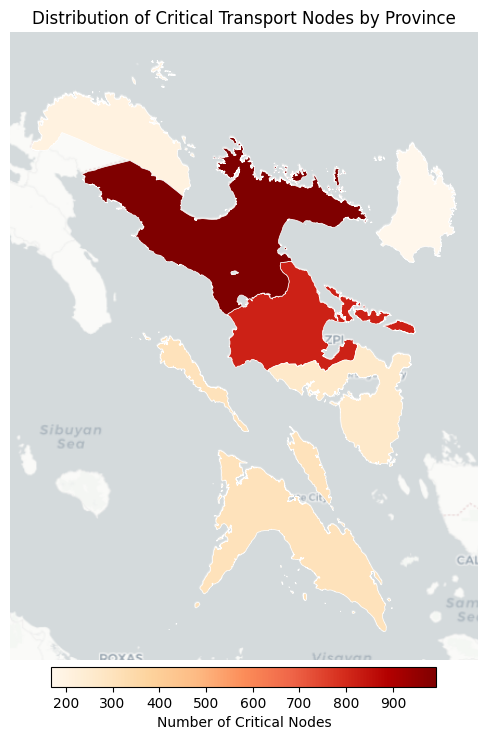
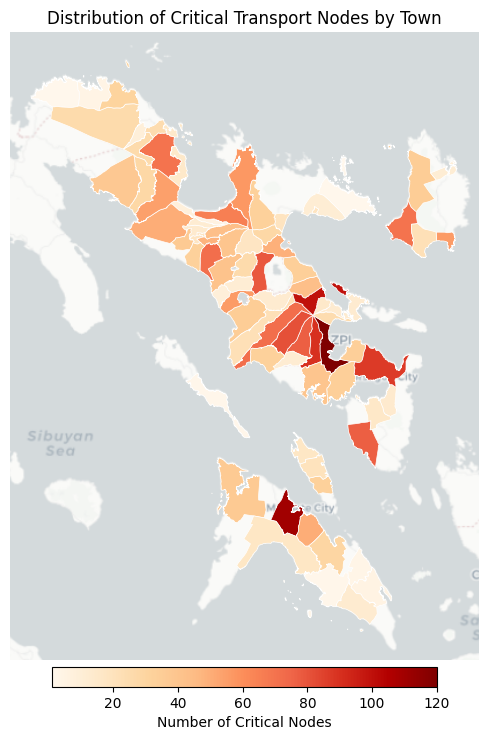
df_town_counts = gdf_critical_nodes_located["town"].value_counts().reset_index()
df_town_counts.columns = ["town", "critical_node_count"]

filepath = os.path.join(BASE_PATH, "critical_nodes_by_town.csv")
df_town_counts.to_csv(filepath, index=False)

print("\n--- Top 15 Towns with Most Critical Nodes ---")
print(df_town_counts.head(15))
--- Top 15 Towns with Most Critical Nodes ---
             town  critical_node_count
0    Legazpi City                  120
1    Masbate City                  110
2     Tabaco City                  100
3          Daraga                   90
4   Sorsogon City                   87
5      Guinobatan                   81
6      Iriga City                   79
7           Bulan                   77
8         Camalig                   77
9      Ligao City                   72
10      Minalabac                   72
11     San Andres                   70
12          Basud                   70
13      Calabanga                   66
14       Tinambac                   57
fig, ax = plt.subplots(1, 1, figsize=(8, 8))
gdf_towns_counts = gdf_boundaries.merge(df_town_counts, on="town")
gdf_towns_counts.plot(
column="critical_node_count",
ax=ax,
legend=True,
legend_kwds={
"label": "Number of Critical Nodes",
"orientation": "horizontal",
"pad": 0.01,
"shrink": 0.5,
},
cmap="OrRd",
edgecolor="white",
linewidth=0.5,
)
cx.add_basemap(
ax,
crs=gdf_towns_counts.crs,
source=cx.providers.CartoDB.Positron,
attribution="",
)
ax.set_title("Distribution of Critical Transport Nodes by Town")
ax.set_axis_off()
plt.tight_layout()
filepath = os.path.join(BASE_PATH, "critical_nodes_choropleth_town.png")
plt.savefig(filepath, dpi=300, bbox_inches="tight")
plt.show()