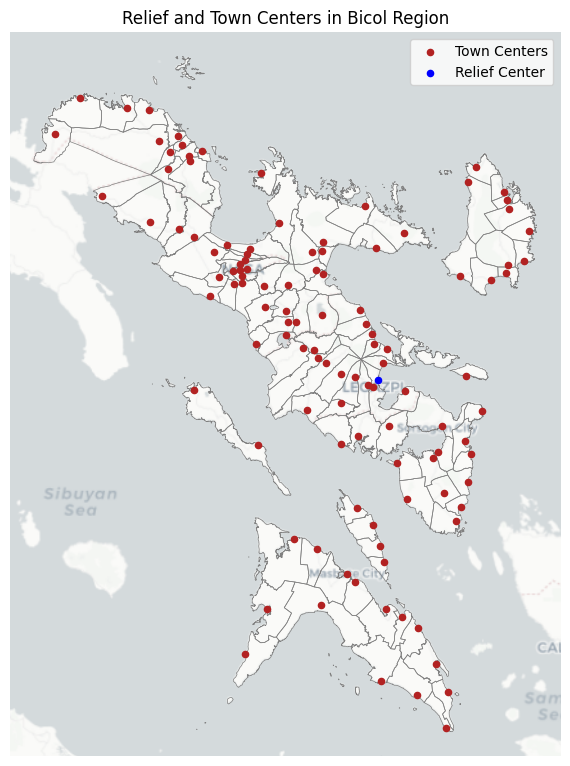
This notebook calculates the baseline travel times for relief delivery. It assigns travel speeds to different road and ferry types to compute the shortest travel time from a central relief hub to every town center.
0 Setup environment
import osimport contextily as cximport geopandas as gpdimport matplotlib.pyplot as pltimport networkx as nximport osmnx as oximport pandas as pd
BASE_PATH ="data"BOUNDARIES_FILE = os.path.join(BASE_PATH, "boundaries.gpkg")MERGED_NETWORK_FILE = os.path.join(BASE_PATH, "merged_network_simplified.graphml")TOWN_CENTERS_FILE = os.path.join(BASE_PATH, "town_centers.csv")# Coordinates of the relief center at DSWD Field Office VORIGIN_COORDINATES = {"lat": 13.167815977098387, "lon": 123.75239324178186}
missing_travel_times = df_town_centers["travel_time"].isna()if missing_travel_times.any():print(df_town_centers[missing_travel_times][["town", "province", "destination_node"]])raiseValueError("Some travel times could not be calculated. Check the nodes.")
print("\n--- Fastest to Reach Town Centers ---")cols = ["town", "province", "travel_time"]df_town_centers[cols].sort_values("travel_time").head(10)
--- Fastest to Reach Town Centers ---
town
province
travel_time
5
Legazpi City
Albay
6.636242
2
Daraga
Albay
8.232893
15
Santo Domingo
Albay
11.975125
1
Camalig
Albay
17.423472
8
Malilipot
Albay
22.400124
0
Bacacay
Albay
22.722983
3
Guinobatan
Albay
25.559240
16
Tabaco City
Albay
28.082637
9
Malinao
Albay
34.188701
7
Ligao City
Albay
37.512479
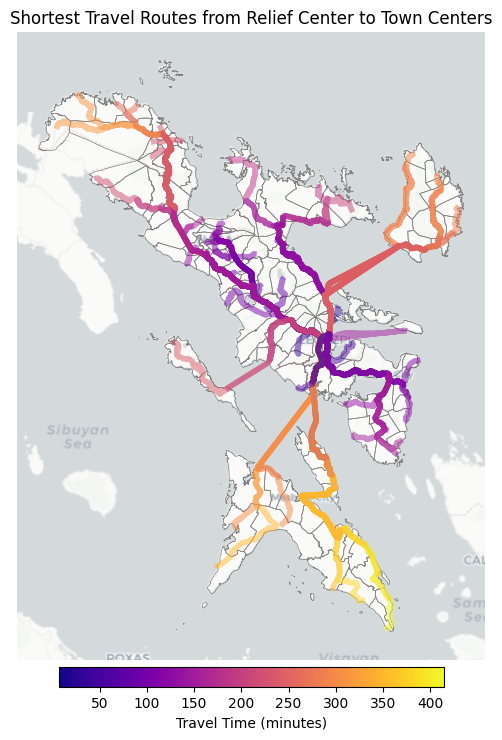
print("\n--- Slowest to Reach Town Centers ---")df_town_centers[cols].sort_values("travel_time", ascending=False).head(10)
import matplotlib.cm as cmimport matplotlib.colors as colorsimport networkx as nximport osmnx as oxdef plot_shortest_paths(G, df_routes, ax): routes = [] travel_times = []for _, row in df_routes.iterrows(): origin_node = row["origin_node"] dest_node = row["destination_node"]try: route = nx.shortest_path(G, source=origin_node, target=dest_node, weight="segment_time") routes.append(route) travel_times.append(row["travel_time"])except nx.NetworkXNoPath:continueifnot travel_times:return min_time =min(travel_times) max_time =max(travel_times) norm = colors.Normalize(vmin=min_time, vmax=max_time) cmap = cm.get_cmap("plasma") route_colors = [cmap(norm(time)) for time in travel_times] ox.plot_graph_routes( G, routes, route_colors=route_colors, route_linewidth=1.5, node_size=0, ax=ax, show=False, close=False ) sm = plt.cm.ScalarMappable(cmap=cmap, norm=norm) sm.set_array([]) cbar = plt.colorbar(sm, ax=ax, orientation="horizontal", pad=0.01, shrink=0.5) cbar.set_label("Travel Time (minutes)")fig, ax = plt.subplots(figsize=(8, 8))gdf_boundaries = gpd.read_file(BOUNDARIES_FILE)gdf_boundaries.plot(ax=ax, edgecolor="gray", linewidth=0.5, facecolor="none", zorder=2)plot_shortest_paths(graph_transport_weighted, df_town_centers, ax=ax)cx.add_basemap(ax, crs=gdf_boundaries.crs, source=cx.providers.CartoDB.Positron, attribution="", zorder=1)ax.set_title("Shortest Travel Routes from Relief Center to Town Centers")ax.set_axis_off()plt.tight_layout()filepath = os.path.join(BASE_PATH, "shortest_paths_map.png")plt.savefig(filepath, dpi=300, bbox_inches="tight")plt.show()
/tmp/ipykernel_22816/975657725.py:34: MatplotlibDeprecationWarning: The get_cmap function was deprecated in Matplotlib 3.7 and will be removed in 3.11. Use ``matplotlib.colormaps[name]`` or ``matplotlib.colormaps.get_cmap()`` or ``pyplot.get_cmap()`` instead.
  cmap = cm.get_cmap("plasma")
/home/ainz/Code/transport-network-analysis/.venv/lib64/python3.13/site-packages/osmnx/plot.py:351: UserWarning: *c* argument looks like a single numeric RGB or RGBA sequence, which should be avoided as value-mapping will have precedence in case its length matches with *x* & *y*.  Please use the *color* keyword-argument or provide a 2D array with a single row if you intend to specify the same RGB or RGBA value for all points.
  ax.scatter(od_x, od_y, s=orig_dest_size, c=route_color, alpha=route_alpha, edgecolor="none")